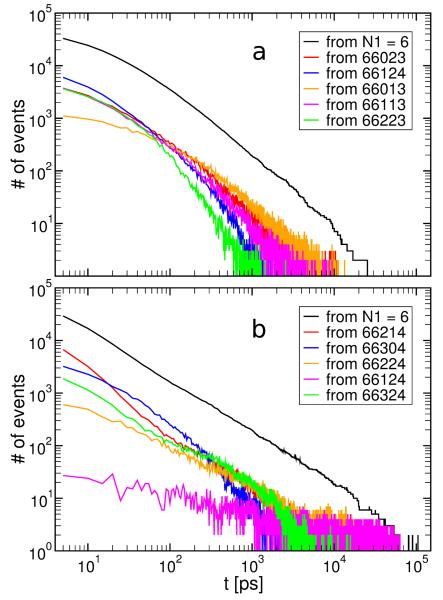
Figure 6.
First passage time distributions for the most populated aggregation states 66123 and 66314 of GNN (a) and KLV (b). The black curve corresponds to FPTDs from any time at which a state with N1 = 6 is present. The colored curves correspond to FPTDs started from specific states. The specific states are the top five with the highest population that contribute most to the distribution from the black curves and are arranged in order of decreasing population from top to bottom.

