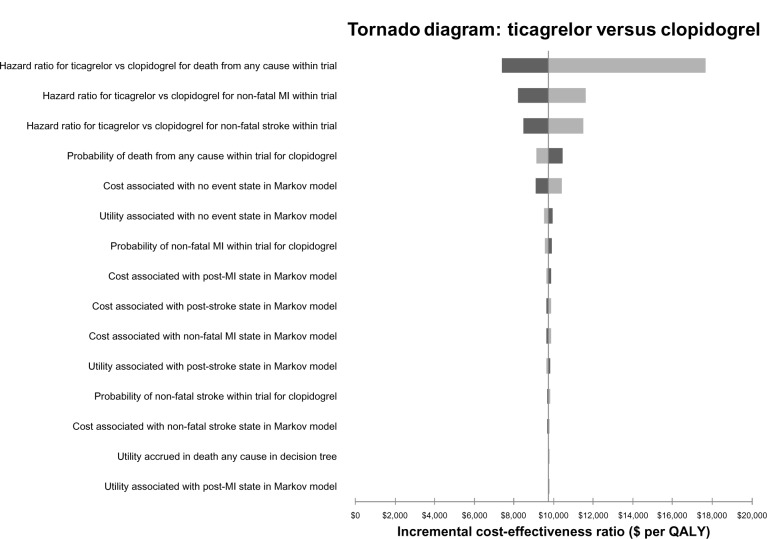
Figure 5.
Tornado diagram of one-way sensitivity analyses for ticagrelor versus generic clopidogrel. The light shading represents the higher value for the input and dark shading represents the lower value for the input.
Note: All values are in Canadian dollars.
Abbreviations: MI, myocardial infarction; QALY, quality-adjusted life year; vs, versus.

