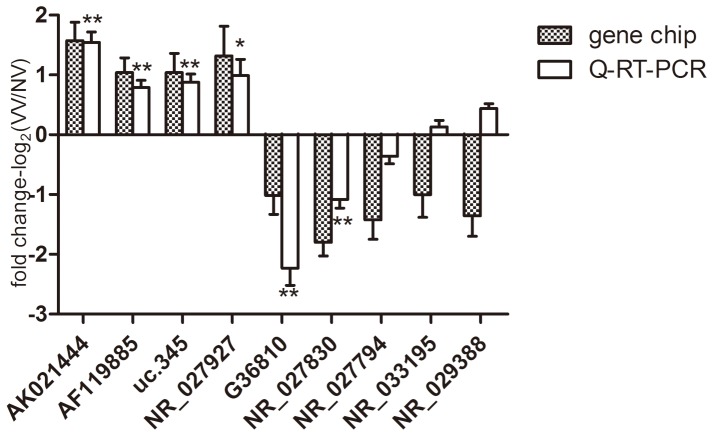
Figure 1. Validation of microarray data and the Q-RT-PCR data.
Nine lncRNAs were chosen for validation in 32 pairs of VVs samples compared with NVs samples by Q-RT-PCR. seven of the nine lncRNAs showed the same trends with respect to up- or down- regulation as the microarray data and six lncRNAs (AK021444, AF119885, G36810, uc.345, NR_027927 and NR_027830) showed statistically significant differences (P<0.05). The heights of the columns in the chart represent the mean expression value of log2 fold changes (VVs/NVs) for each of the nine validated lncRNAs in the microarray and Q-RT-PCR data; The bars represent standard errors. The validation results indicated that the microarray data were closely correlate with the Q-RT-PCR results. *: P<0.05, **: P<0.01.

