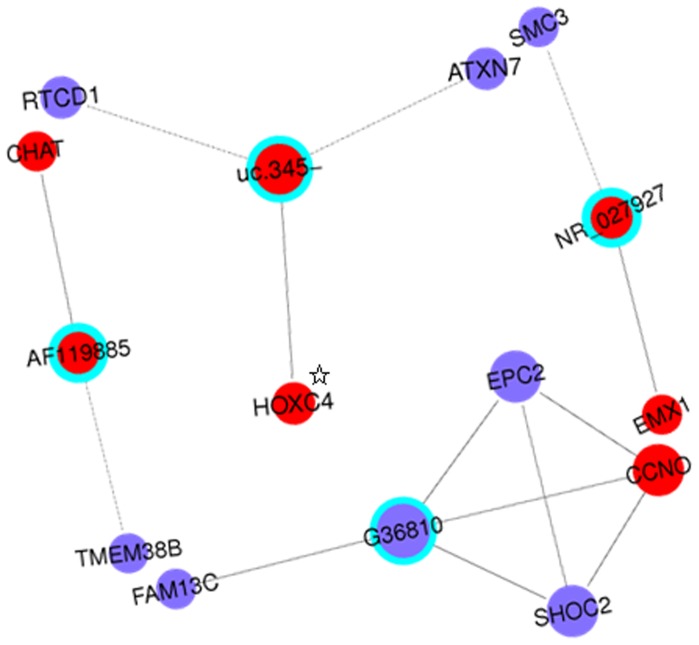
Figure 2. Coding-non-coding gene co-expression network of the four lncRNAs.
The network represents co-expression correlations between the four lncRNAs and significantly differentially expressed mRNAs. Only co-expression gene pairs with Pearson coefficient (|r|)>0.99 are shown. Four separate networks were constructed. They are displayed together in this figure. Gene nodes with a cyan node lines represent lncRNAs and gene nodes without node lines represents a protein-coding RNA (mRNA). Red nodes represent up-regulated RNAs, and blue nodes represent down-regulated RNAs. Solid lines between two nodes indicate positively correlated interactions between RNAs, and dotted lines indicate negatively correlated interactions. Node size represents the node degrees. ☆indicates protein coding RNA transcribed from natural antisense strands of the gene HOXC4.

