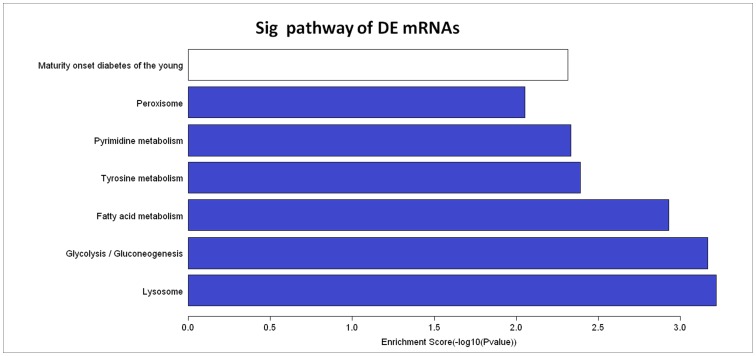
Figure 3. Pathways of dysregulated mRNAs with the enrichment scores (−log10 (P-value))>2.
The bar plot shows the enrichment scores (−log10 (P-value)) value of the significant enrichment pathways. The white bar shows the pathway in which the up-regulated mRNAs were found to be involved and the blue bars show the pathways in which the down-regulated mRNAs were found to be involved. Pathway analysis involves mapping genes to KEGG pathways. The P-value denotes the significance of the correlation between the pathway and the conditions. Most of the shown here are related to metabolism, which indicates that the varicose veins may be a metabolic disease.

