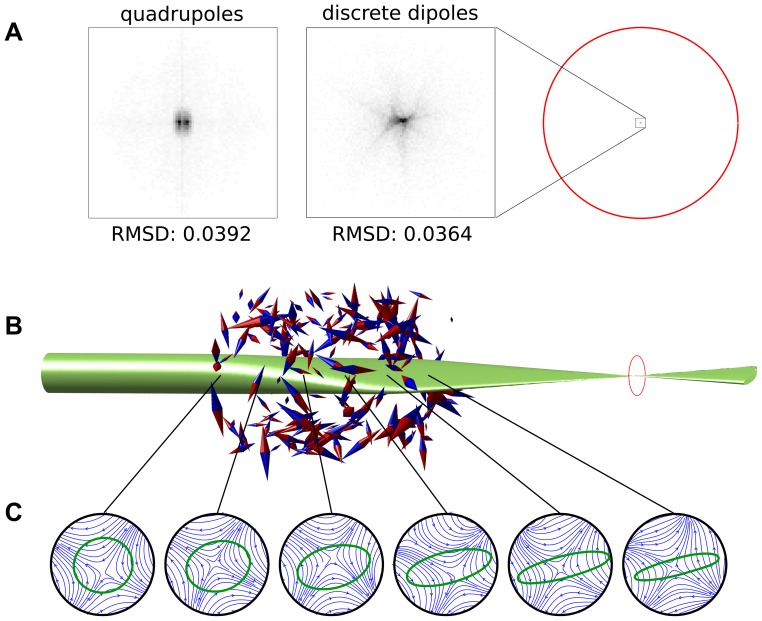
Figure 3. Illustration of the magnetic beam focuser.
A: Particle distribution in a cross-section of the focal plane, shown for 50,000 particles, both for a set of two ideal quadrupoles and our configuration (CT-RTRL results). The cost function, the root mean squared distance (RMSD) of the particles w.r.t. the focal point as they pass through the focal plane, is shown underneath the panels. On the right we show the scale compared to the original beam width (red circle). Note that the spread of the particles for the quadrupoles is largely due to a relatively large spread in particle velocities. B: Illustration of the particle beam envelope (light green) and the spatial configuration of magnets (blue red cones), indicating position, direction and magnitude. C: Cut-through illustrations of the particle beam envelope and the lateral magnetic field at different positions throughout the beam focuser.

