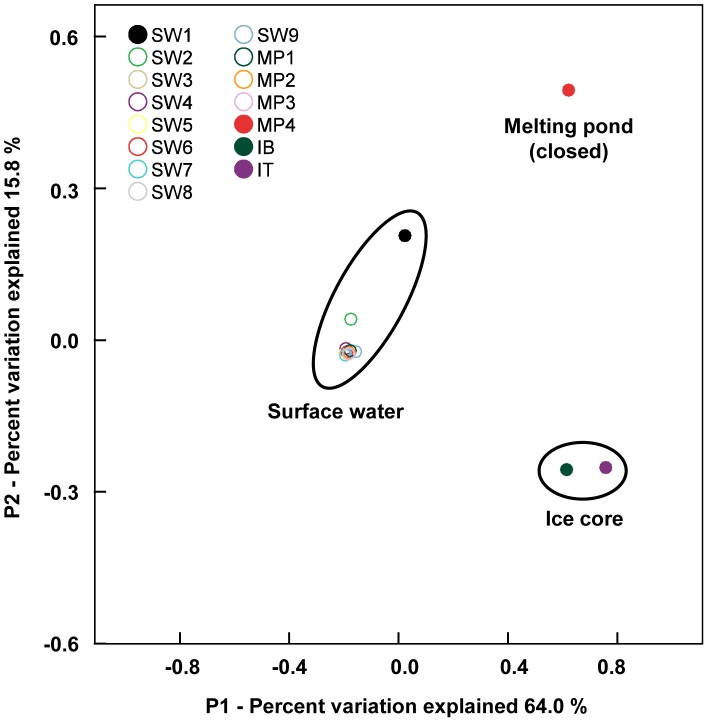
Figure 3. Beta diversity analysis.
Species diversity of bacterial communities is expressed by the Principal Coordinates Analysis (PCoA) and represents the differentiation among samples. Comparison of the variation between samples is explained along the P1 (64.0%) and P2 (15.8%) axes. SW1 to SW9 represent seawater samples (described in Fig. 1A). MP1 to MP4 represent water samples collected from melting ponds, and IB and IT represent the bottom and top layers of the ice core, respectively, in the sea-ice station (described in Fig. S1). Ellipses were drawn manually to aid in visualizing results.

