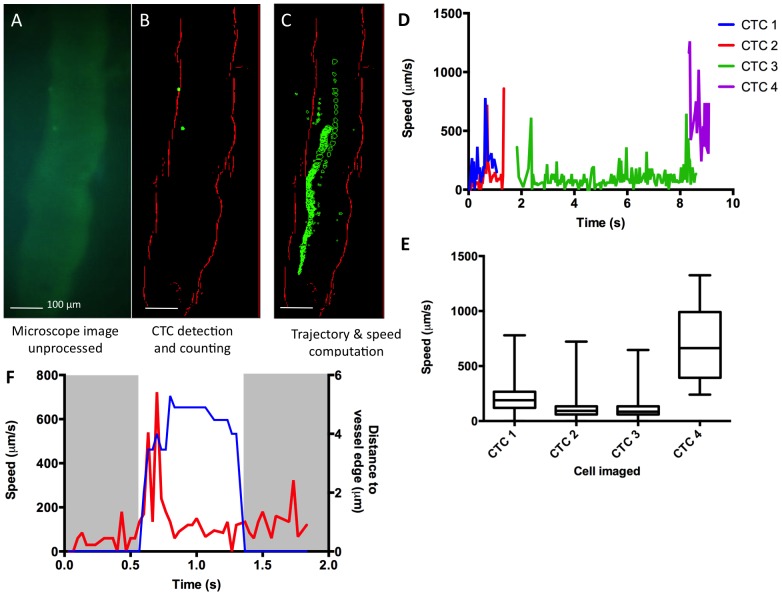
Figure 3. In vivo CTCs imaging using miniature mountable intravital microscopy (mIVM) method.
(A, B, C) In vivo imaging of CTCs using the mIVM after systemic injection of FITC-dextran for vessel labeling followed by injection of 1×10⁶ 4T1-GL labeled with CFSE. (A) Raw image from the miniature microscope. (B) Image processed by our MATLAB algorithm for detection of CTCs and vessel edges. (C) Computing of CTCs trajectories within the blood vessel. (D) Quantification of the speeds of CTCs over time as imaged in Movie S1, and (E) corresponding average speeds per CTC, plotted as box and whiskers where the box extends from the 25th to 75th percentiles and the whiskers extend from the minimum to the maximum speed values measured. (F) For the slowest CTC – CTC2 on (D, E) – details of the speed of the cell over time (red curve) and the corresponding location of the cell relative to the vessel edge (blue curve).

