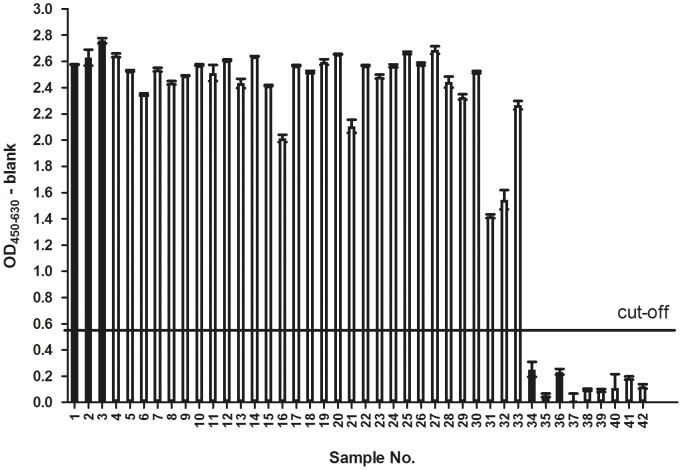
Figure 4. Graphical representation of results obtained with modified commercial anti-HSV ELISA.
In total 42 serum samples were analyzed. The black bars indicate positive (samples 1–3) and negative (samples 34–36) references; Source: National B Virus Resource Laboratory, Atlanta, USA. Open bars represent samples derived from the DPZ rhesus macaque breeding groups. The cut-off value was defined as twice the value of the reaction of the negative reference sample (# 34) yielding the highest O.D. among the three negative reference samples and is indicated by a horizontal line. Sera were tested at a 1∶200 dilution. Standard deviations (SD) of duplicate measurements are indicated.

