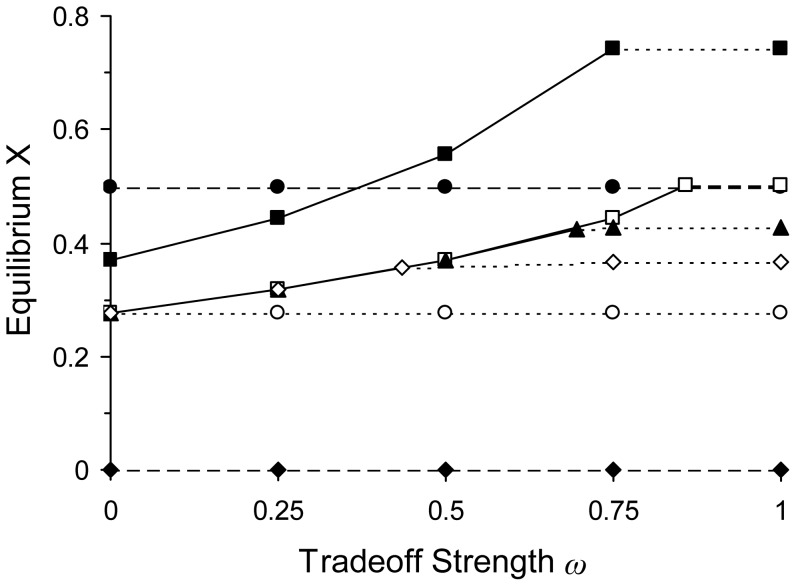
Figure 2. Effect of tradeoff strength on equilibrium X for different antibiotic treatments.
Tradeoff strength is measured as the parameter ω (Figure 1). The equilibrium frequency of uninfected patients Xˆ was determined by running simulations of the model until all frequencies were stable. In cases where the values fluctuated, the equilibrium frequency was the average for the cycles. All simulations were run with parameter values of MICA 1 = MICB 2 = 240; MICAS = MICBS = MICA 2 = MICB 1 = 0; MICA 2 and MICB 3 as defined in Figure 1; φ max = 0.25; φ min = –0.25; c = 0.1; σ = 0.25; β = 1.0; and γ = 0.25. These values are in the range of the numbers used by Bergstrom et al. and Regoes et al. During simulations, an MIC with a value of zero was reset to 0.000001 to avoid division by zero in Equations 6–8. Treatments: NONE ( ); CONTROL (•); SINGLE (○); CYCLING (π = 50,▴); MIXING (π = 50, ▴); Combined COCKTAIL (□); Separate COCKTAIL (▪). Our analysis included values of π greater and smaller than 50 for CYCLING and MIXING, but the data are not presented to avoid crowding the figure. We note here that if π = 1, Xˆ values in both treatments became indistinguishable from those in MIXING with π = 50 and for all sampled values of ω. If π was increased above 50, Xˆ values in CYCLING converged downwards to match those in SINGLE, while in MIXING they decreased to match those in CYCLING (π = 50). The largest value examined was π = 50,000. The matching of MIXING (π = 50,000) and CYCLING (π = 50) is coincidental, as the value of π = 50 was chosen arbitrarily. The composition of the infected population (S+R 1+R 2+R 3) is shown in the graph by using the line pattern to represent the most common bacterium in the population; S (– – –); R 1 and/or R 2 (· · ·); R 3 (—). For example, in Combined COCKTAIL (□), the most common bacterium is R 3 from 0≤ω<0.86, but changes to S from 0.86≤ω≤1.

