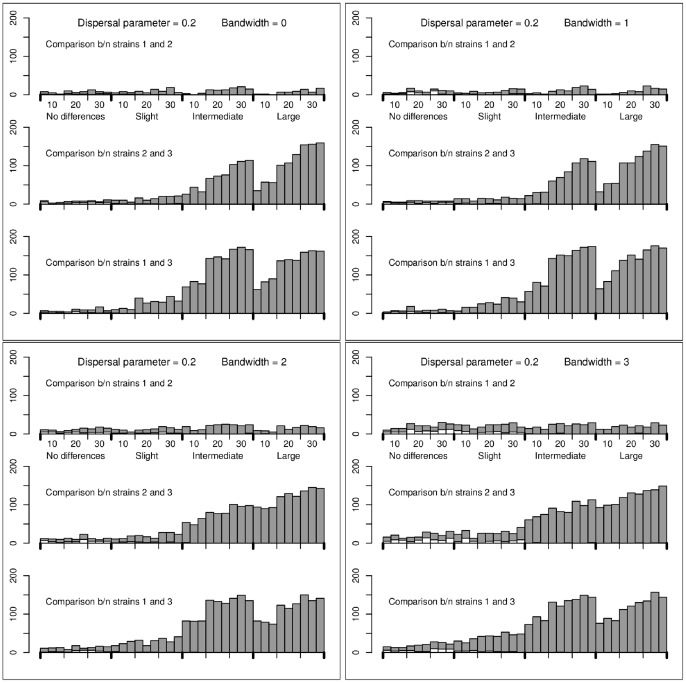
Figure 1. Numbers of test rejections for simulations performed under the mechanistic model with dispersal parameter γ = 0.2.
Grey bars: number of times that the null hypothesis was rejected and that the alternative was true; White bars: number of times that the null hypothesis was rejected and that the alternative was wrong. The rejection threshold was fixed at 0.05/3 (using Bonferroni’s correction). The number of sampling sites and the differences in the fitness coefficients are given under the x-axis of the top panels. Moreover, between each consecutive ticks, there are three bars corresponding, from left to right, to 1, 5 and 10 collected samples per sampling site. The results are provided for the bandwidth values  (top left),
  (top right),
  (bottom left) and
  (bottom right).

