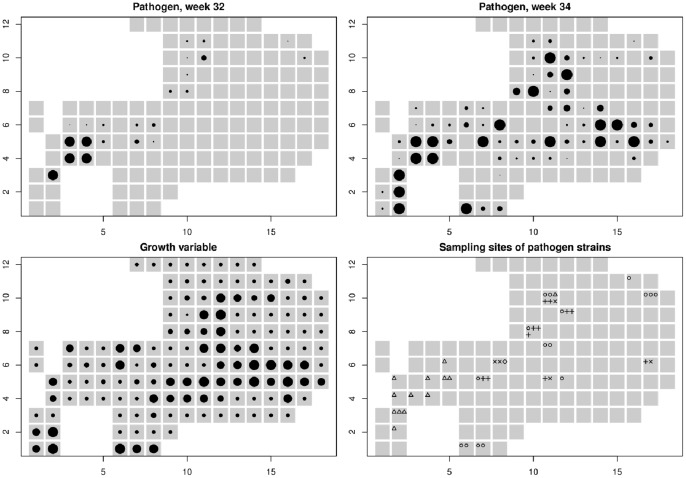
Figure 3. Powdery mildew data and growth variable in a patch of Plantago lanceolata in the Åland islands.
In all the panels the grey squares represent the grid cells covering the host population. Top panels: number of infected leaves in  square cells at weeks 32 (left) and 34 (right) of year 2011 (dot size proportional to number of infected leaves that ranges between 0 and 137). The axis scales indicate the number of the cell from the most bottom-left cell. Bottom left: Growth variable
  (dot size linear in
  that ranges between −1.01 and 4.93). Bottom right: sites where samples were collected (46 samples in 22 sites; diamond: strain 1; plus: strain 2; triangle: strain 3; circle: strain 4; cross: strain 5).

