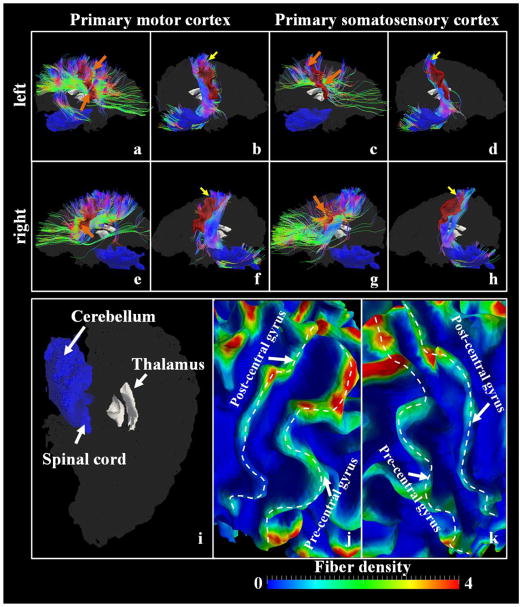
Figure 10.
Joint visualization of the primary motor cortex/the primary somatosensory cortex (red color patches) and white matter fibers emanating from them. (a) The left primary motor cortex patch and fibers connecting other cortical regions; (b) The left primary motor cortex patch and fibers connecting the spinal cord/thalamus; (c) The left primary somatosensory cortex patch and fibers connecting other cortical regions; (d) The left primary somatosensory cortex patch and fibers connecting the spinal cord/thalamus; (e) The right primary motor cortex patch and fibers connecting other cortical regions; (f) The right primary motor cortex patch and fibers connecting the spinal cord/thalamus; (g) The right primary somatosensory cortex patch and fibers connecting other cortical regions; (h) The right primary somatosensory cortex patch and fibers connecting the spinal cord/thalamus; The yellow arrows highlight the regions where fibers connecting the spinal cord/thalamus penetrate the cortex, while the orange arrows highlight the regions penetrated by fibers derived from other cortical regions. The whole brain surfaces are shaded as a background with the thalamus regions detailed in (i). The fiber density, defined as the number of fibers penetrating 1-mm2 area on the surface, is mapped onto the surfaces. The zoomed-in views of the left central sulcus and the right central sulcus regions are shown in (j) and (k), respectively. The dashed white curves highlight the gyral crest lines.

