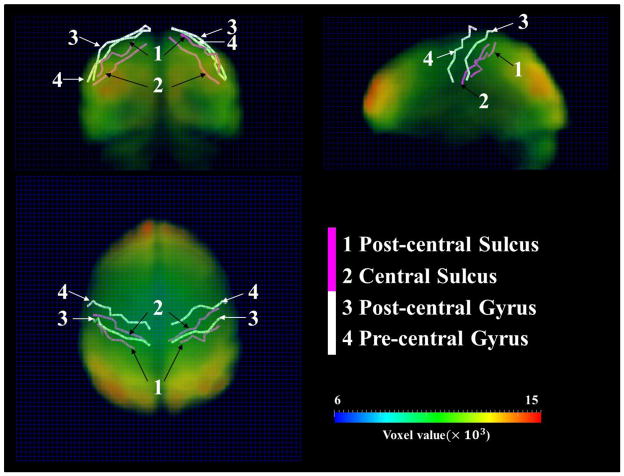
Figure 11.
Joint visualization of the original fMRI volume data (time point 1), the pre/post-central gyrus crest lines (white curves) and the central/post-central sulcus fundi (purple curves). The 64×64×30 volume grid (dark blue mesh) is used as the background to facilitate visual observation. The gyral crest lines and sulcus fundi are extracted on the cortical surface reconstructed from DTI data and transformed in fMRI volume image space via FSL FLIRT. The original fMRI volume image is color-coded according to the ‘voxel value’ color bar at the right bottom.

