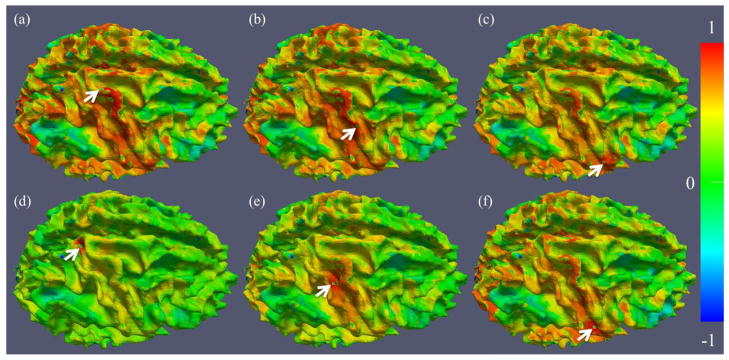
Figure 5.

Examples of cortical connectivity maps of selected landmarks (pointed by white arrows). (a)–(c): three landmarks on the RPCG; (d)–(f): three landmarks on the RCS. The color bar is on the right. The results shown in this figure are in agreement with the proposed functional model.
