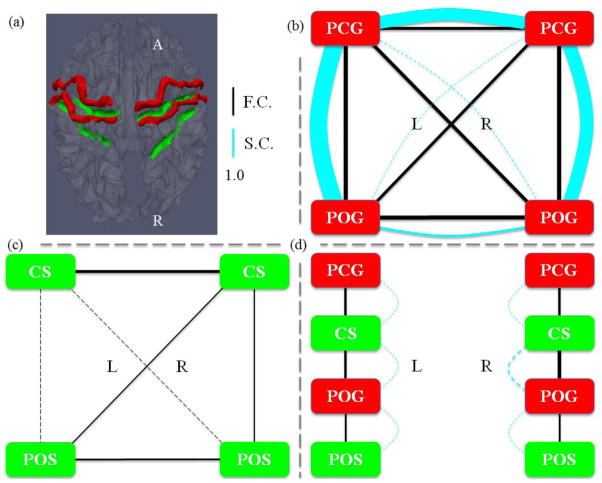
Figure 7.
(a) Illustration of the four gyral regions (red) and four sulcal regions (green). In (b)–(d), the width of a functional connection edge (black) is proportional to the functional connectivity (F.C.). The width of a structural connection edge (cyan) is proportional to the structural connectivity (S.C.). Weak edges (width less than 1.0) are in dashed lines, which are significantly weaker than the average. (b) Joint representation of structural and functional connectivity among four gyri. Strong structural connectivity was observed in LPCG-LPOG, RPCG-RPOG, and LPCG-RPCG, which are significantly stronger than the average. (c) Joint representation of structural and functional connectivity among four sulci. No or very weak structural connectivity was observed in the DTI data. (d) Joint representation of structural and functional connectivity between adjacent gyri and sulci.

