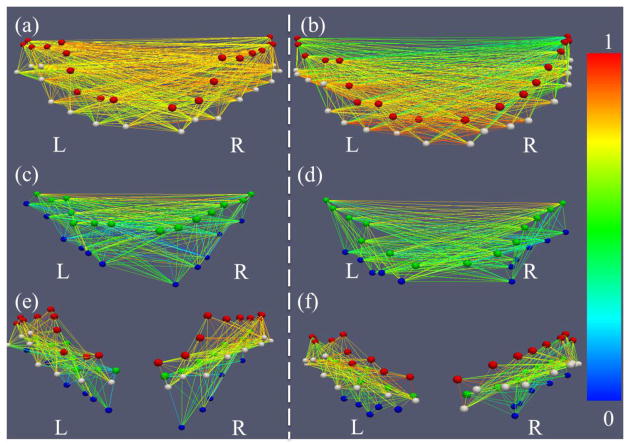
Figure 9.
Examples of functional connectivity patterns for two randomly selected subjects (left and right panels, respectively). Red, white, green, and blue bubbles represent the landmarks on PCG, POG, CS, and POS, respectively. The edges are colored based on the functional connectivity strength according to the color bar on the right. (a) and (b) are gyrus-gyrus pairs; (c) and (d) are sulcus-sulcus pairs; (e) and (f) are adjacent gyrus-sulcus pairs.

