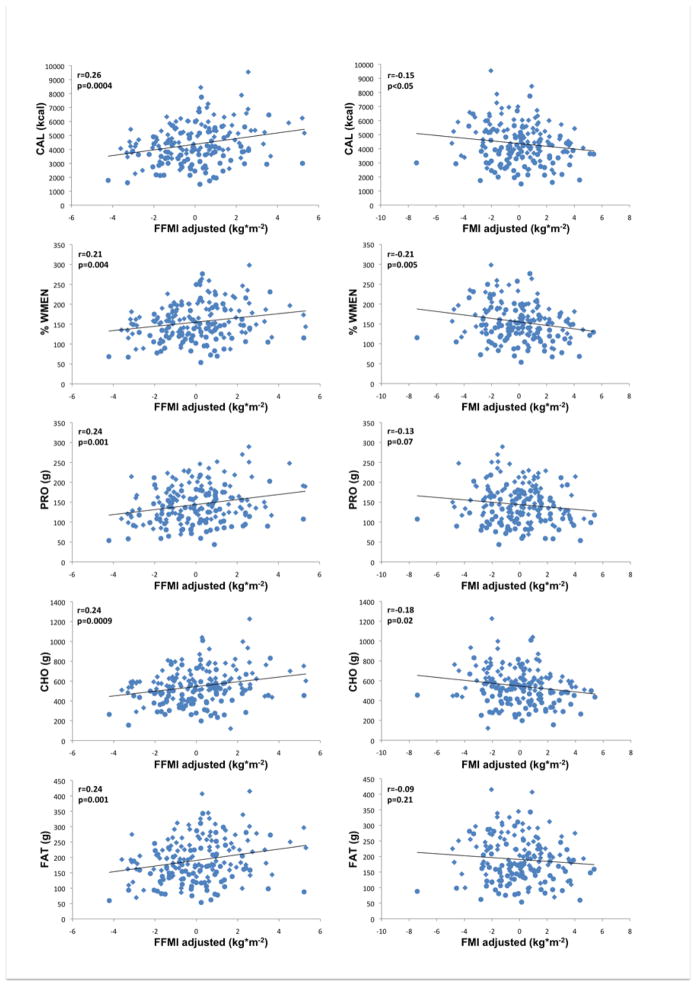
Figure 3.
Left column illustrates associations of fat-free mass index (FFMI kg*m−2,) adjusted for fat mass index, age, gender, and ethnicity with food and macronutrient intake. Right column illustrates associations of fat mass index (FMI kg*m−2) adjusted for fat-free mass index, age, gender, ethnicity with food and macronutrient intake; CAL, mean daily caloric intake; PRO, mean daily protein intake; CHO, mean daily carbohydrate intake; FAT, mean daily fat intake; %WMEN, percentage weight maintenance energy needs; rs indicates Spearman’s ranked correlation coefficient. Circles indicate female gender, diamonds indicate male gender.

