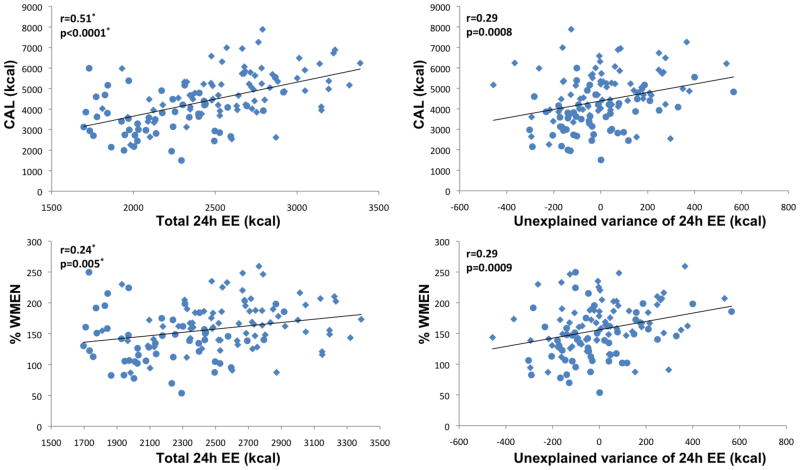
Figure 4.
Left column illustrates associations of total 24h energy expenditure (24h EE) with mean daily caloric intake (CAL) and overconsumption (%WMEN, percentage weight maintenance energy needs). Right column illustrates associations of 24h EE adjusted for age, gender, ethnicity, fat-free mass and fat mass (i.e. unexplained variance of 24h EE) with CAL and %WMEN. Circles indicate female gender, diamonds indicate male gender. * p values and correlation coefficients were calculated accounting for physical activity.

