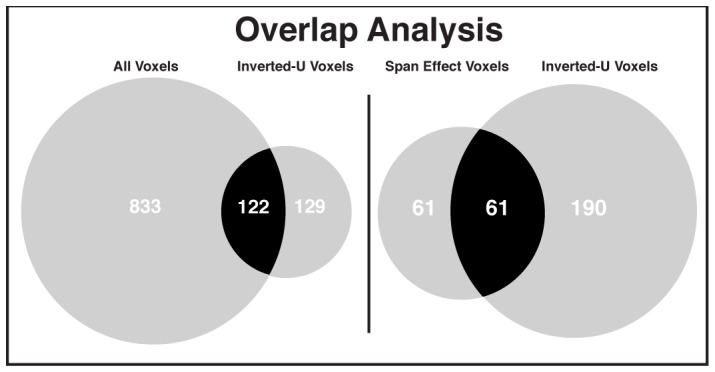
Figure 4. Venn diagrams illustrating degree of overlap.

Left. Venn diagram illustrates the degree of overlap between caudate voxels identified as correlated with the midbrain (p < 0.05, FDR and small-volume corrected) collapsed across span and drug condition (left circle) and caudate voxels identified as having an inverted-U shaped relationship with the midbrain (p < 0.05, uncorrected; right circle). Only 122/(122+833) voxels (13%) exhibiting significant midbrain-caudate connectivity also exhibit an inverted –U shaped response dependent on span and drug. Right. Venn diagram illustrates the degree of overlap between caudate voxels identified as having greater connectivity with the midbrain in higher span subjects in the placebo sessions (left circle) and caudate voxels identified as having an inverted-U shaped relationship with the midbrain (p < 0.05, uncorrected). Only 61/(61+61) voxels (50%) exhibiting a significant increase in midbrain-caudate connectivity based on span also exhibit an inverted-U shaped response dependent on span and drug. The number of voxels is presented within the circles.
