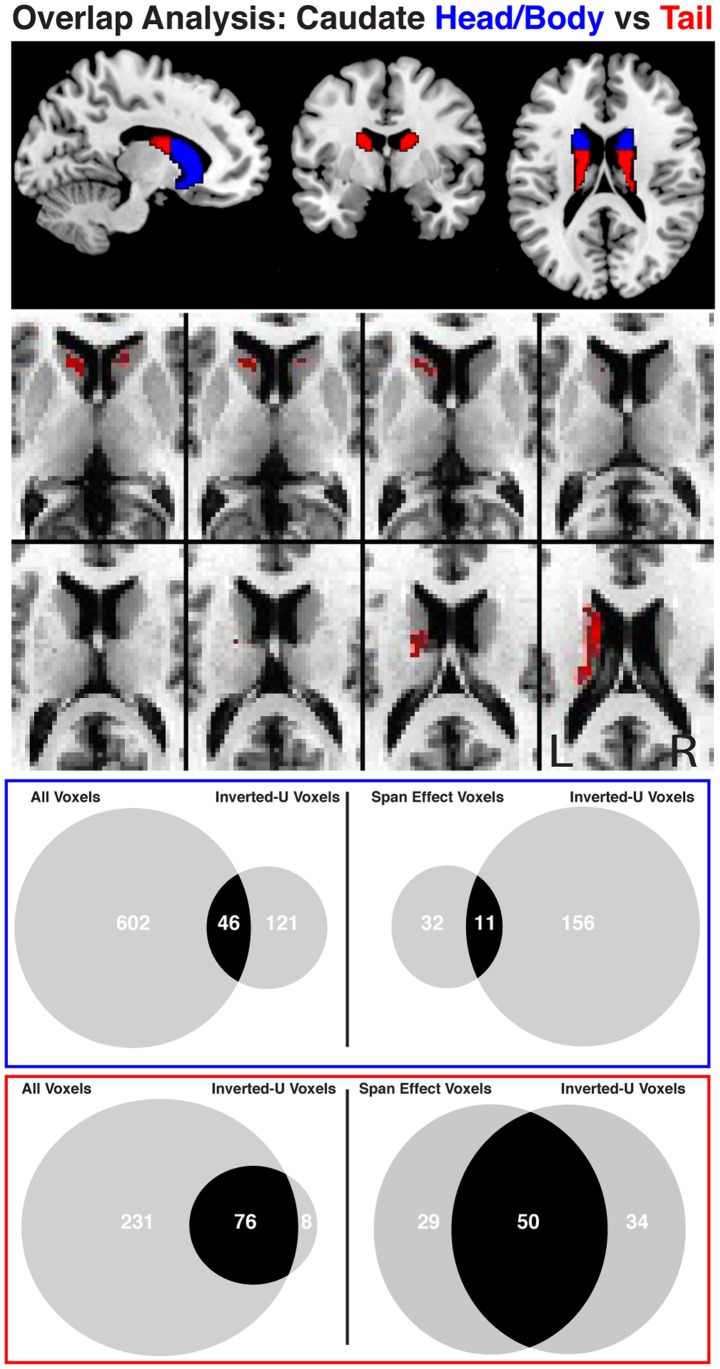
Figure 5. Division of the caudate into a head/body and tail regions is displayed at the top of the figure.
Venn diagrams illustrate the degree of overlap between caudate voxels (middle figure – head/body; bottom figure – tail) identified as correlated with the midbrain (p < .05, FDR and small-volume corrected) collapsed across span and drug condition (left circle) and caudate voxels identified as having an inverted-U shaped relationship with the midbrain (p < 0.05, uncorrected; right circle). A significantly greater percentage of overlapping voxels are present in the tail than the head/body of the caudate.

