
Figure 1.
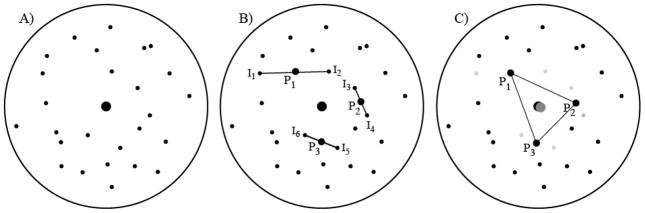
A geometric representation of how parceling works. Each circle represents the domain of possible indicators of a construct. The construct’s ‘true’ centroid is the larger dot in the center of each circle. The average of any two variables is the mid-point of a straight line as depicted in B (the average of three or more indicators would be the geometric center of the area that they encompass). The latent construct that is indicated by the parcels is the center dot in gray that nearly overlaps the true centroid as in C. Figure copyright, Todd D. Little.