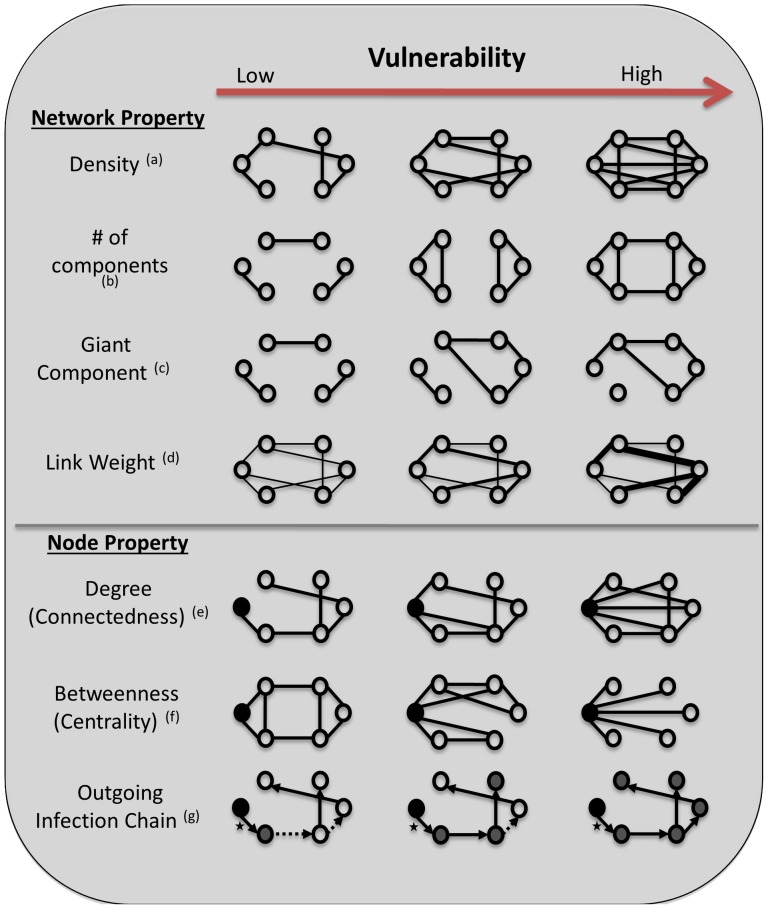
Figure 1. Changes in Network and Node Properties Associated with Increasing Vulnerability.
Network Properties – properties of the entire network which impact vulnerability (a) Density (ratio of edges to nodes) – As this ratio increases, there is an increase in connections between nodes, increasing the potential paths for disease spread. (b) Number of components (number of independent/isolated sub groups) – A decrease in the number of isolated groups increases the reachability of any random node (c) Giant Component (largest independent/isolated sub group) – if the largest component contracts infection, this infection can spread further through the Giant Component compared to smaller, more isolated components which will make the whole network more vulnerable. (d) Link Weight (strength of relationship/number of units moved or frequency of movement) – As more units are moved or units are moved more frequently, there is an increase in the chance of moving infected individuals. Node Properties – properties of each node which make the node more vulnerable or impact the vulnerability of the rest of the network. Black node = focal node (e) Degree (number of edges) – increases in the number of edges any node has increases the vulnerability of that node to potential transmission (must have contact/connection to transfer infection) (f) Betweenness (how often a node lies on the shortest path between two other nodes) – with low vulnerability the focal node has low betweenness and for the highest vulnerability the focal node has maximum betweeness, where every node must go through the focal node to reach any other node. (g) Infection chain (the number of nodes that can be reached by the focal node, accounting for timing of movements) – the focal node has a single edge (*), and those edges in the network which are formed before this edge (i.e. those animal transfers which happen before the focal node formed) cannot contribute to the infection chain, and are depicted with a dashed line. Edges which form after this edge are depicted with a solid line. With the lowest vulnerability, the focal node can only form a chain of one, because the outgoing edge from the next node has already formed. With medium vulnerability, the subsequent edge is formed after the focal node’s edge, thus stock could move from the focal node to 3 other nodes, giving it an infection chain of 3. In the final figure all movements occur subsequent to the formation of the focal node and thus the infection chain for this node increases to 5.

