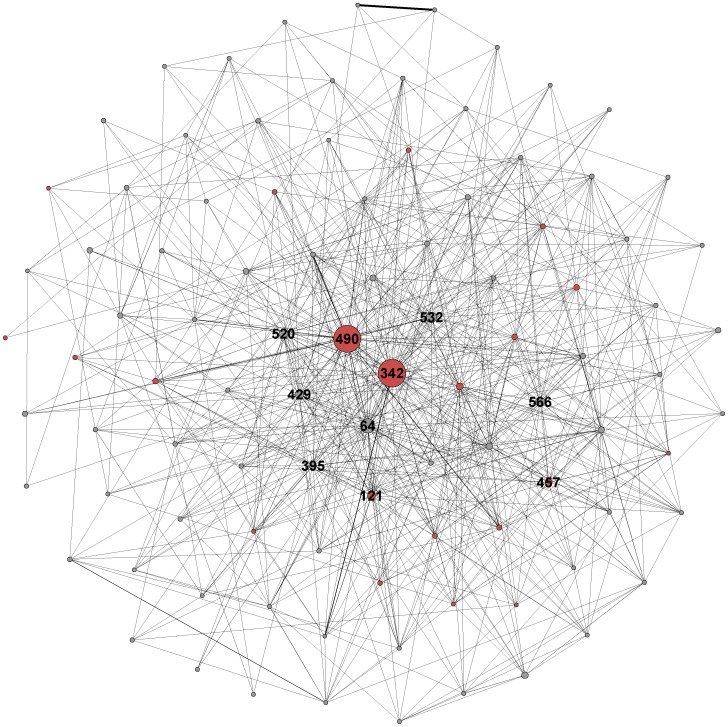
Figure 2. Full ostrich movement network visualization with the least connected nodes (degree <20) not shown.
The farm ID numbers for the 10 most connected nodes are displayed, and all farms which tested positive for HPAI are shaded red and the farm ID number displayed for the ten farms with the highest degree.

