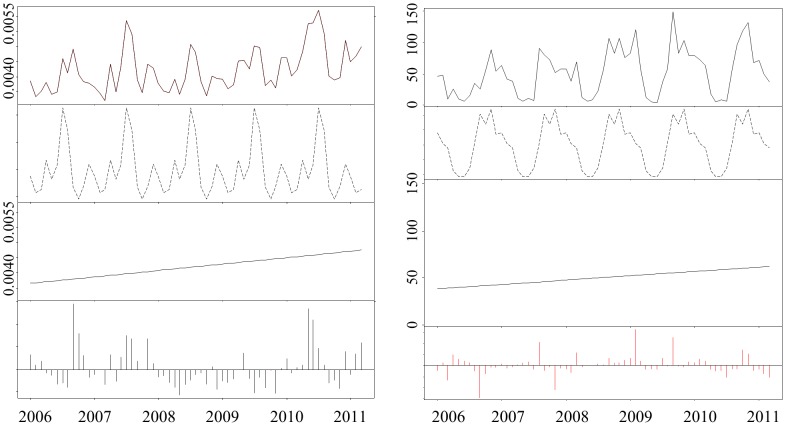
Figure 4. The results of a Bfast analysis of the (a) network density and the (b) Max outgoing infection chain.
The top frame of each panel displays the network index at each time step, while the second panel depicts seasonal variation detected in the measure over time. This variation is then removed and the resulting trend is displayed in panel three. The fourth panel depicts residual variation which cannot be accounted for in the seasonal variation or trend.

