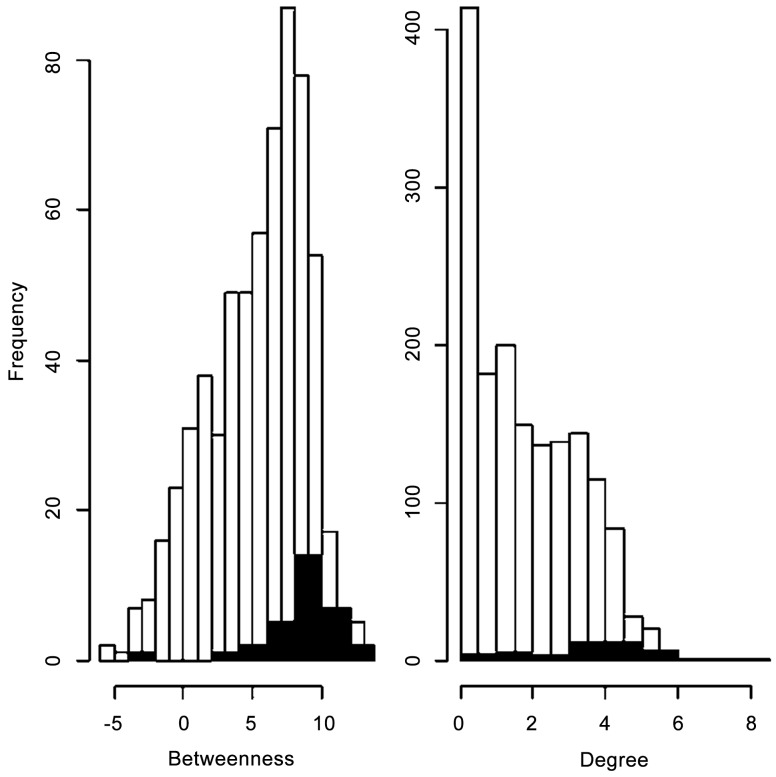
Figure 6. The distribution of logged betweenness (nInfected = 23, nNon_Infected = 324) and degree (nInfected = 42, nNon_Infected = 1575 scores for all farms (white) as well as the farms which tested positive for HPAI (black).
A Wilcoxon signed rank test revealed that the infected farms are significantly different from infected farms in the network in both betweenness (p<0.001) and degree (p<0.001).

