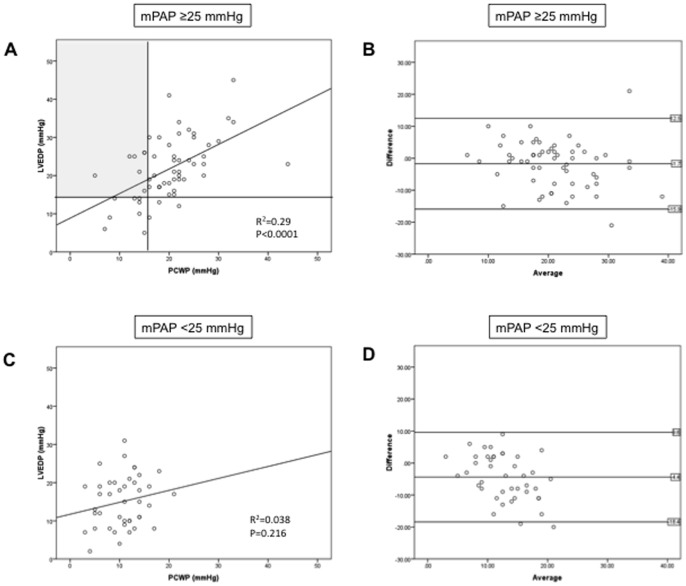
Figure 4. Correlation and agreement between PCWP and LVEDP in patients with (A, B) or without (C, D) pulmonary hypertension.
Vertical line in (A) divides patients in patients with PCWP ≤15 mmHg or >15 mmHg; horizontal line divides patients in patients with LVEDP ≤15 mmHg or >15 mmHg. Shaded area in (A) represents the patients with PCWP ≤15 mmHg, but LVEDP >15 mmHg, thus indicating patients that would have been incorrectly classified as pre-capillary PH in absence of LVEDP measurement. See fig. 3 for explanation of Bland-Altman plot labeling.

