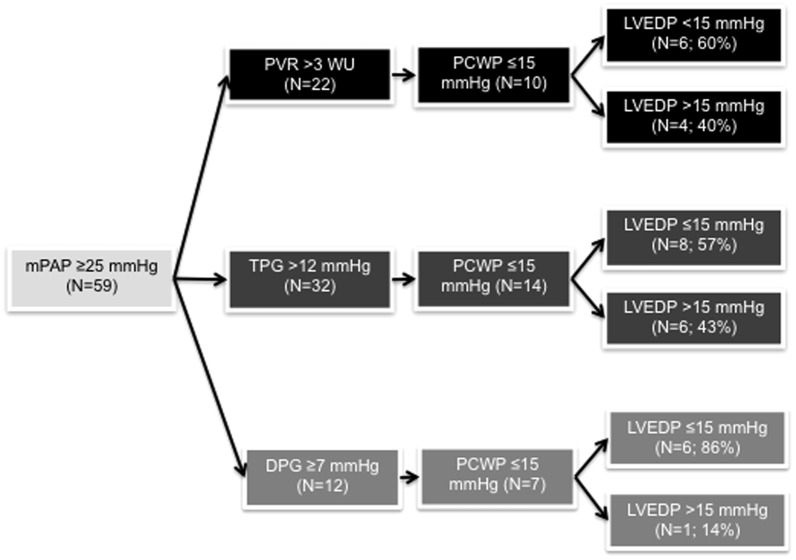
Figure 5. Distribution of patients with LVEDP ≤15 mmHg or LVEDP >15 mmHg in patients with PCWP ≤15 mmHg and PVR >3 WU (upper panel; black), TPG >12 mmHg (middle panel; dark grey), or DPG >7 mmHg (bottom panel; light grey).
DPG, diastolic pressure gradient; PVR, pulmonary vascular resistance; TPG, transpulmonary gradient.

