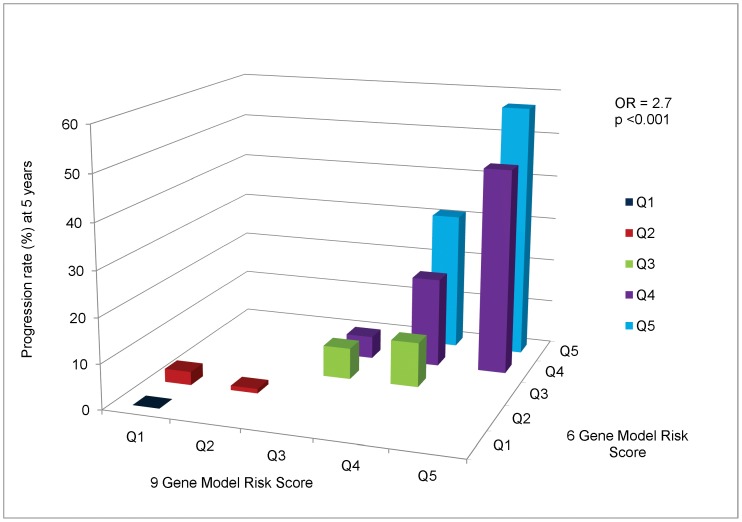
Figure 1. Cross-Classification of Progression Rates to Advanced AMD: 9 Gene Model vs 6 Gene Model.
Cross-classification of subjects by risk score quintile for 9 and 6 gene models, with estimated progression rates for each combination of a 9 gene quintile by 6 gene quintile. OR = odds ratio of progression per one quintile increase in 9 gene model, holding 6 gene model quintile constant.

