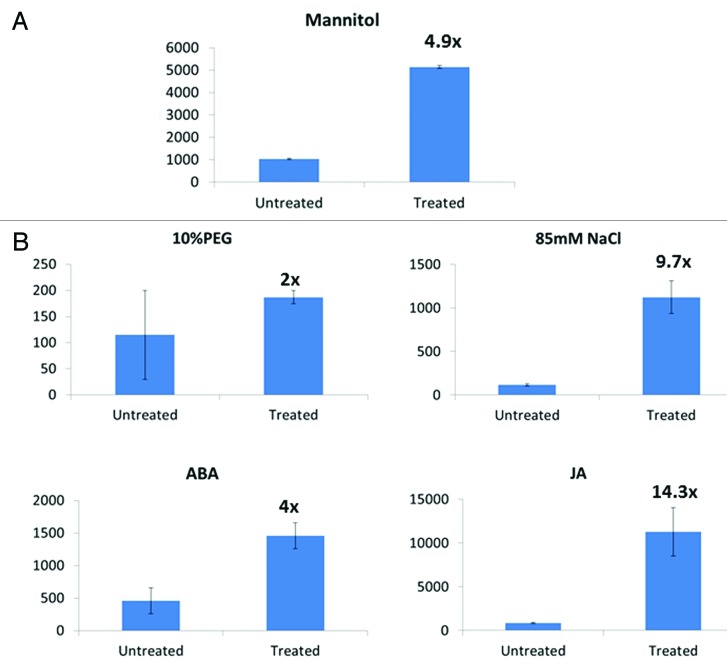
Figure 2. (A) GUS activity of Nt RS promoter:GUS in 10% mannitol. The figure shows average of three independent experiments involving five independent transgenic lines. The values on the top of black color treated columns shows the average fold induction. GUS assays were performed as previously described.15 (B) GFP activity of GmWRKY53 promoter: GFP BY-2 in 10% PEG, 0.5% (85 mM) NaCl.,100 µM ABA and 100 µM JA. The figure shows the average of three independent experiments involving five independent transgenic lines and bars represent standard error. The values on the top of black color treated columns shows the average fold induction. The scale bar represents 50 μm for NtRS and GmWRKY53 was used.

An official website of the United States government
Here's how you know
Official websites use .gov
A
.gov website belongs to an official
government organization in the United States.
Secure .gov websites use HTTPS
A lock (
) or https:// means you've safely
connected to the .gov website. Share sensitive
information only on official, secure websites.
