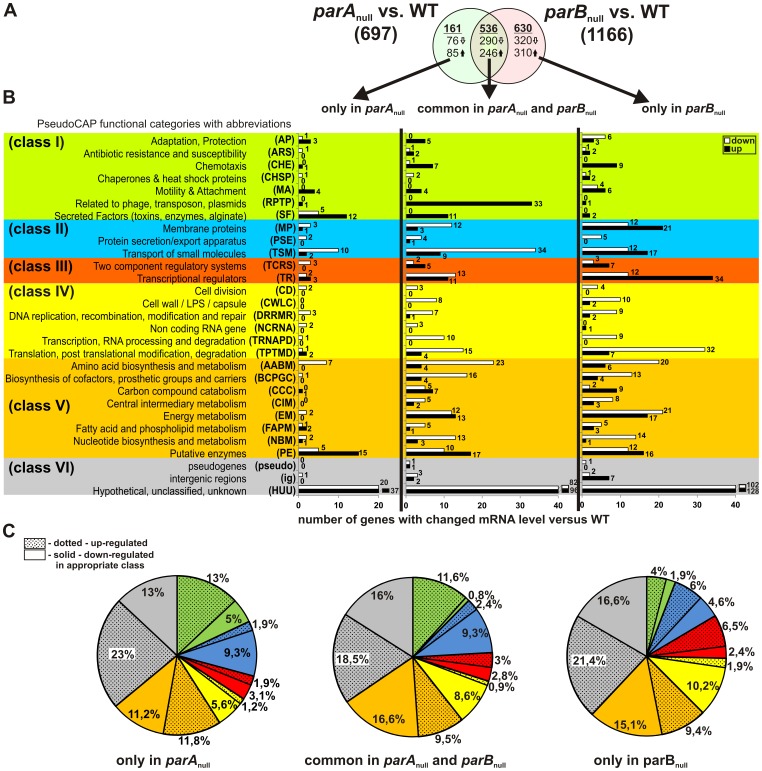
Figure 2. Functional classification of genes differentially expressed in logarithmically growing cultures of P. aeruginosa par mutants.
(A) Venn diagram demonstrating the number of genes with changed mRNA level (fold change ≥2; p-value ≤0.05) in parA null and parB null mutant strains as compared to reference WT PAO1161 P. aeruginosa strain. Three gene set lists were created representing genes differentially expressed only in parA null, with different expression in both par mutants (common in parA null and parB null) and with different mRNA level only in parB null. (B) Functional classification of identified genes according to their predicted or known functions. Functional classes are taken from PseudoCAP [29] and are listed on the left with abbreviations in brackets. The original PseudoCAP functional categories were further grouped into six larger classes encompassing: (I) adaptation, protection, motility (green panel); (II) membrane proteins, transport, secretion (blue panel); (III) signal transduction, regulatory functions (red panel); (IV) cellular processes (yellow panel); (V) metabolism (orange panel); (VI) hypothetical, unknown functions (grey panel). (C) The pie charts created for each gene set list illustrating the percentage of genes in each class accounted for the total number of genes with changed expression for: only in parA null, common in parA null and parB null and only in parB null gene set list.

