
Figure 2. DNA methylation profile of the Per2 promoter region following sevoflurane anesthesia.
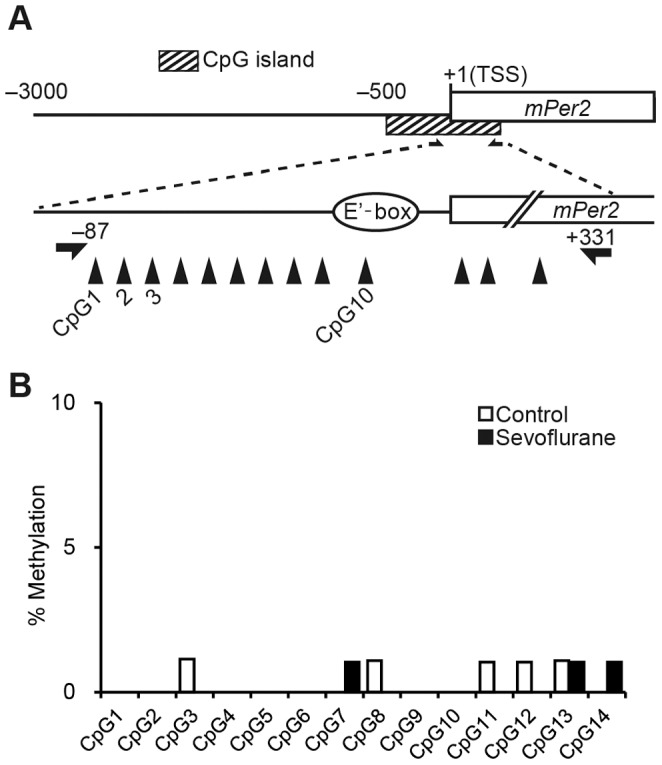
(A) Diagram of CpG island around the Per2 locus. CpG sites are numbered and indicated by upward arrowheads. Arrows indicate pairs of methylation-specific primers used to amplify the region of the CpG island containing the E’-box. (B) Methylation rate of 10 individual sites in the Per2 promoter and four CpG sites in exon 1.