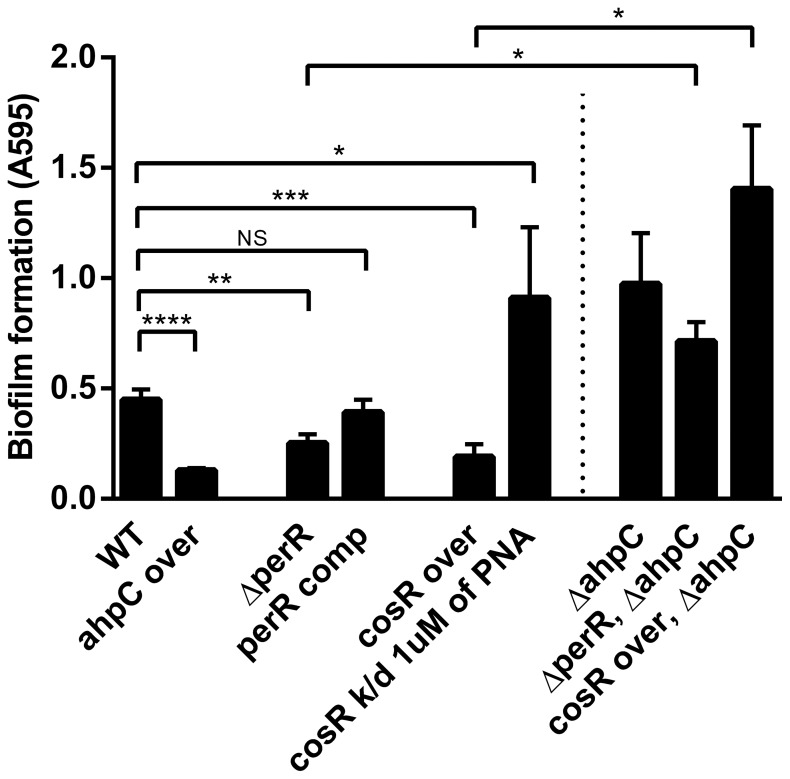
Figure 2. Effect of increased ahpC expression on biofilm formation.
Biofilm formation levels were determined with crystal violet staining after 24 h incubation of samples. The results show the means and standard deviations of a representative experiment with triplicate samples. The experiment was repeated six times and all produced similar results. The statistical differences between the wild type and each mutant were determined by t-test. NS: non-significant, *P≤0.05, **P≤0.01, ***P≤0.001, ****P≤0.0001.

