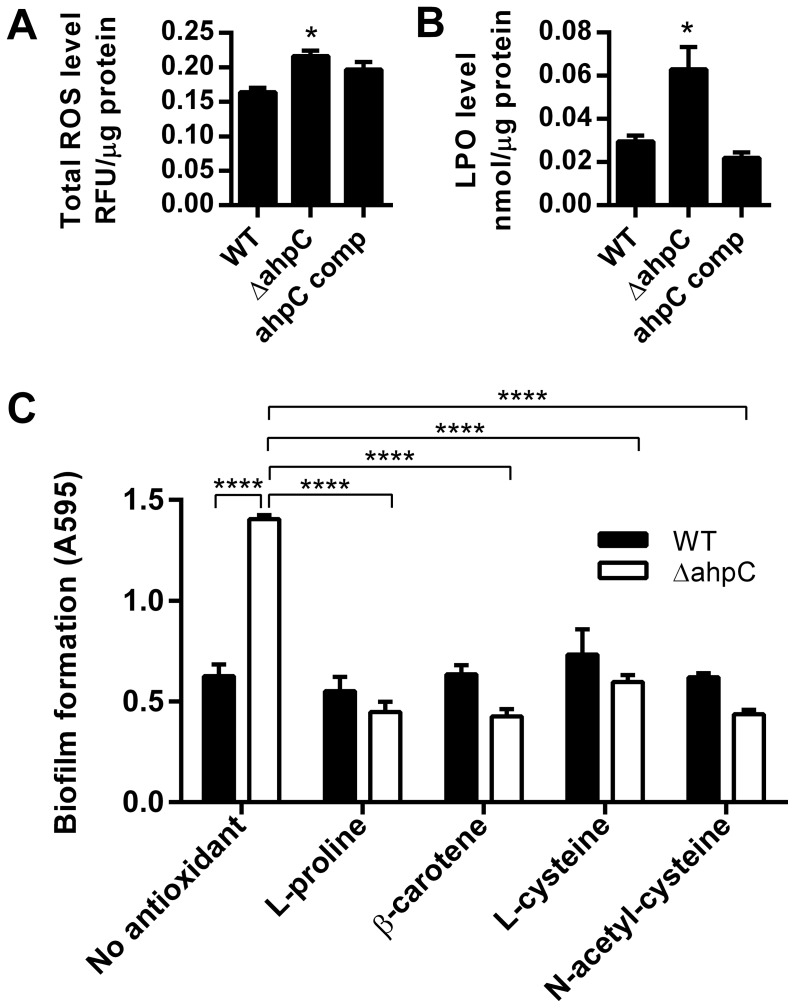
Figure 3. Determination of total ROS level (A) and lipid hydroperoxide (LPO; B) in the ahpC mutant, and reduced biofilm formation in the ahpC mutant by treatment with antioxidants (C).
The assays were carried out with 24 h old samples. Antioxidants were treated to a final concentration of 1nM. The results show the means and standard deviations of a representative experiment with triplicate samples. The assays were repeated at least three times and similar results were reproducible in all the experiments. Statistical significance was analyzed with t-test (Fig. 3A and 3B) and two-way ANOVA (Fig. 3C). *P≤0.05, ****P≤0.0001.

