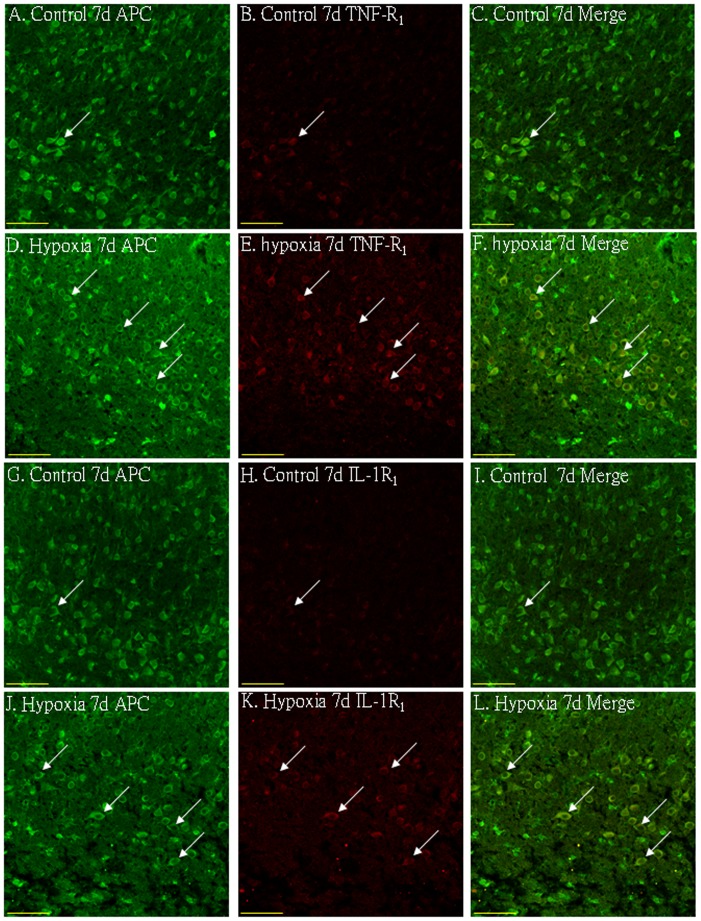
Figure 3. Confocal images showing the distribution of APC (A, D, G, J, green), tumor necrosis factor receptor 1 (TNF-R1) (B, E, red) and interleukin-1 receptor 1 (IL-1R1) (H, K, red) in oligodendrocytes (arrows) in the PWM at 7 days after the hypoxic exposure and the corresponding control.
The co-localized expression of APC with TNF-R1 and IL-1R1 is depicted in C and F, I and L, respectively. Note the expression of TNF-R1 and IL-1R1 is upregulated after the hypoxic exposure. Scale bars: A–L, 50 µm.

