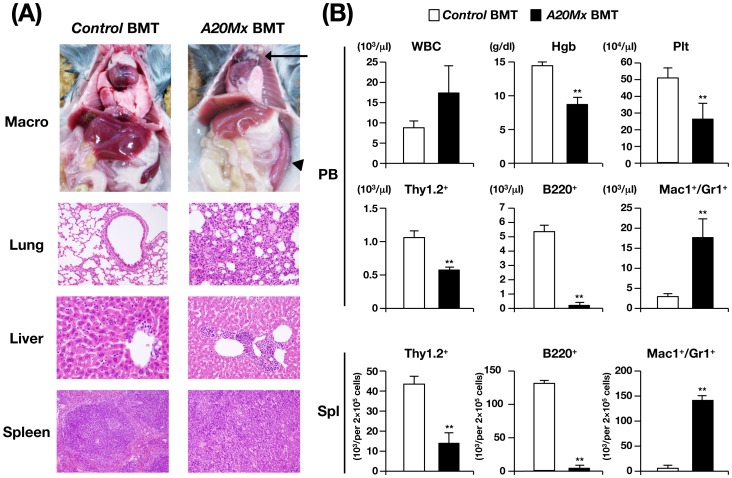
Figure 2. Analysis of A20Mx BMT mice.
(A) Macroscopic appearance and pathological images of control BMT and A20Mx BMT mice. The atrophic thymus and enlarged spleen are indicated by an arrow and an arrowhead, respectively. Note the infiltrating hematopoietic cells in the lung and liver and the destruction of spleen architecture caused by excessive proliferation of myeloid cells in A20Mx BMT mice. (B) Time-dependent changes in hematopoietic parameters in the PB and spleen. **p<0.01 (Student’s t-test).

