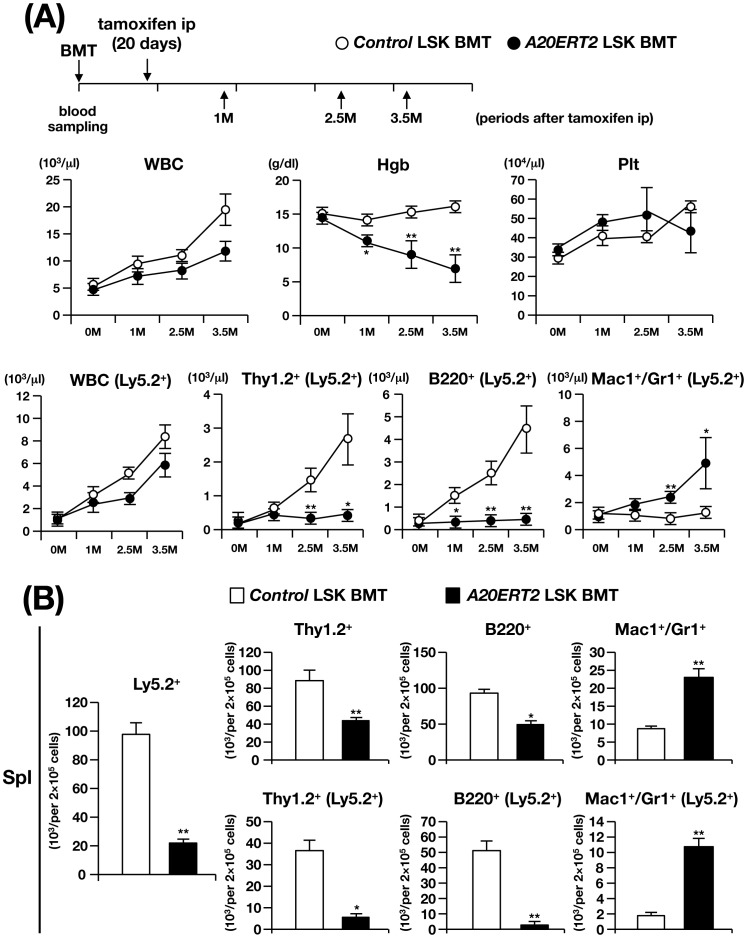
Figure 5. Analysis of control and A20ERT2 LSK BMT mice.
(A) Time schedule of BMT, tamoxifen ip, blood sampling, and time-dependent changes of hematopoietic parameters and percentages of Ly5.2+ cells in the PB. *p<0.05 and **p<0.01 (Student’s t-test). (B) Percentages of different hematopoietic compartments and the population of Ly5.2+ cells in the spleen 3.5 M after transplantation. **p<0.01 (Student’s t-test).

