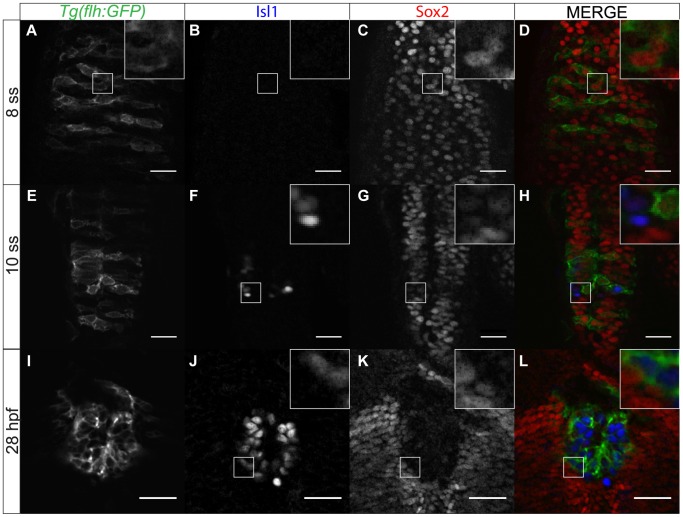
Figure 2. Sox2 expression within the pineal anlage is downregulated with differentiation.
(A–D) Sox2 expression overlaps with expression of flh, a marker for pineal precursors, at 8 ss. (E–H) As pineal cells start differentiating, Isl1 is upregulated whereas Sox2 is downregulated. Yellow arrows show cells that have both Isl1 and Sox2 expression at low levels. (I–L) Sox2 is absent from the fully differentiated pineal cells. Scale bars = 25 µm, optical sections from confocal microscopy, insets show a three times magnified view of the image, (E,I,M) GFP expression of Tg(flh:GFP) (F,J,N) immunofluorescence for Isl1, (G,K,O) immunofluorescence for Sox2, (H,L,P) merged images with Tg(GFP:flh) in green, Isl1 in blue and Sox2 in red, developmental stages are shown at the beginning of each row.

