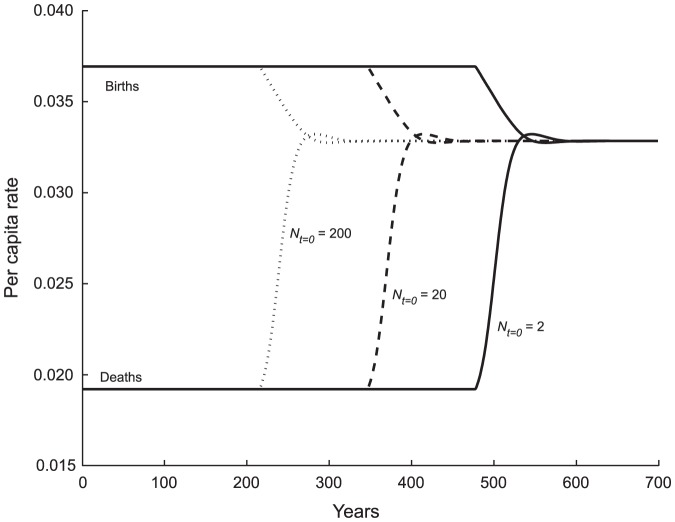
Figure 4. Effect of Settlement Population Size N 0 on the Time Course of Vital Rates.
Increasing the size of the founding group by factors of 10, from 2 to 20 to 200, decreases the length of the copial phase by a constant 131 years each step, a log-linear relationship. During the copial phase per capita births and death rates, hence the reproductive rate, r, are unchanging. The transition phase in which birth and death rates converge (at b = d = 0.033) arrives sooner with larger settlement, but it otherwise is of the same form and duration for each scenario. At Malthusian equilibrium, the population numbers  = 13,509 individuals, who have a life expectancy of
  = 30.0 yrs; the food ratio is
  = 0.668.

