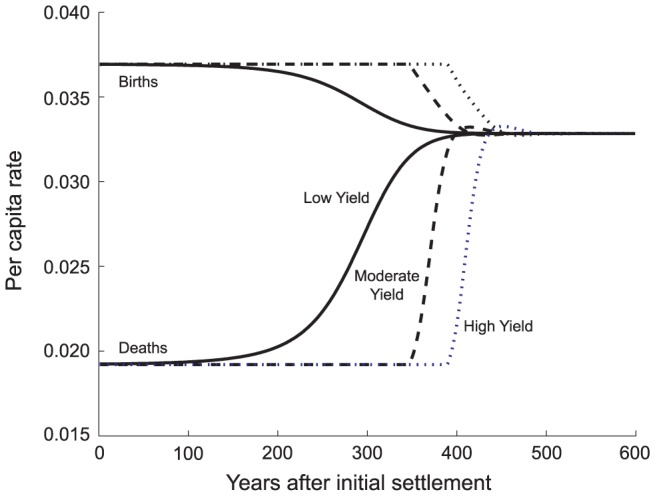
Figure 6. Effect of Yield (Y) on the Time Course of Vital Rates.

The solid, low-yield, curves represent 7000 kcal/ha/day; the dashed, moderate yield curves a 3-fold increase to 21,000 kcal/ha/day; and, the dotted, high-yield curves another 3-fold increase to 63,000 kcal/ha/day. Because the low yield situation is below adequate kcal intake at settlement, there is no copial phase as fertility falls and mortality rises smoothly with further declines in food availability. The approach to equilibrium is slow, the transition phase extended. The moderate- and high-yield cases allow the population to grow at its maximum, constant rate until food availability drops below E = 1. They exhibit a lengthy copial phase. The moderate-yield population experiences hunger first, but in each case the approach to equilibrium is rapid once E has fallen below 1. At equilibrium,  = 0.668 and
  = 30.0 for each level of yield. Equilibrium population density, however, increases with yield;
  = 2799;
  = 13,509;
  = 27,287.
