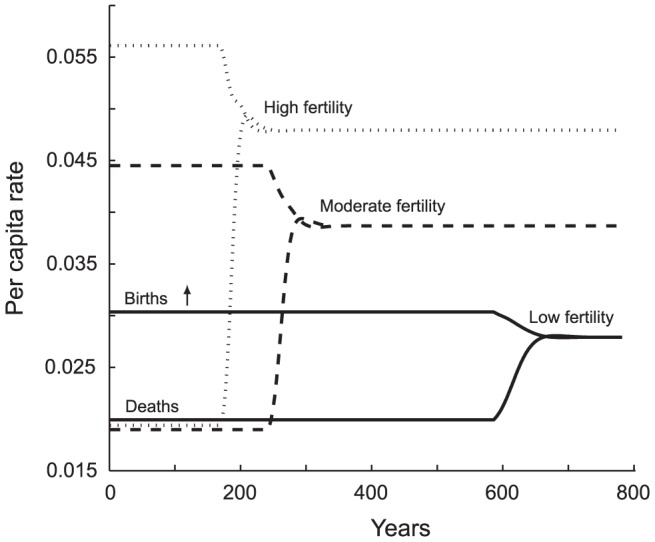
Figure 8. Effect of Total Fertility Rate (TFRd) on the Time Course of Vital Rates.

Assessing TFRd at E = 1, the low-fertility population's TFRd is 2 daughters per mother (solid line), the moderate TFRd is 3 (dashed line) and the high fertility population has a TFRd of 4 (dotted line). Mortality tends to be more responsive than fertility in our parameterization of the model, so when fertility is high the gap between the vital rates is closed at equilibrium by a marked rise in morality. The result is higher fertility and mortality at equilibrium than in the other scenarios. Generally, lower maximum fertility also means lower per capita mortality at equilibrium, as shown by the per capita rate at which morality and fertility converge. The high-fertility population also grows quickly; it thus has a shorter copial phase, experiences hunger sooner, and has a steeper, more abrupt approach to equilibrium. It is the least well-fed at equilibrium and has a very short life expectancy. In numbers: High fertility population:  = 0.579;
  = 20.4;
  = 15,956. Moderate fertility population:
  = 0.624;
  = 25.4;
  = 14,601. Low fertility population:
  = 0.731;
  = 35.3;
  = 12,247.
