
Table III.
Perceived (% by Category) Benefits of the Application of Quality by Design in Response to “When Comparing to a Traditional Paradigm, Indicate How You Agree or Disagree with the Following Statements”
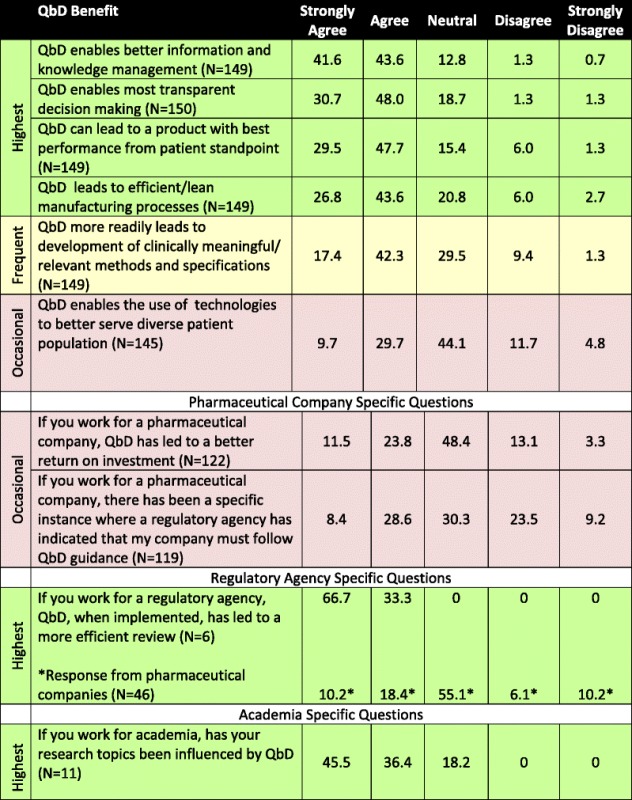
Table is color-coded with respect to degree of motivation: highest benefit where >70% of respondents indicated that they agreed or strongly agreed with the statement (green); frequent benefit where 50% to 60% of respondents indicated that they agreed or strongly agreed with the statement (yellow), and occasional benefit where <50% of respondents indicated that they agreed or strongly agreed with the statement (purple)