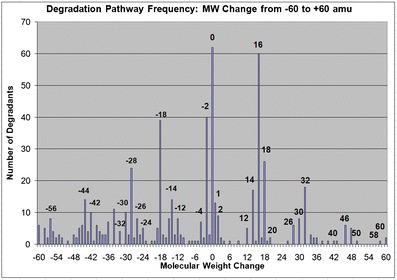
Fig. 5.

A plot of the frequency of specific MW changes from parent observed in degradation products contained in the Pharma D3 database in 2009. The height of the specific bar graphs indicate the most frequent MW changes from parent as a result of drug degradation processes
