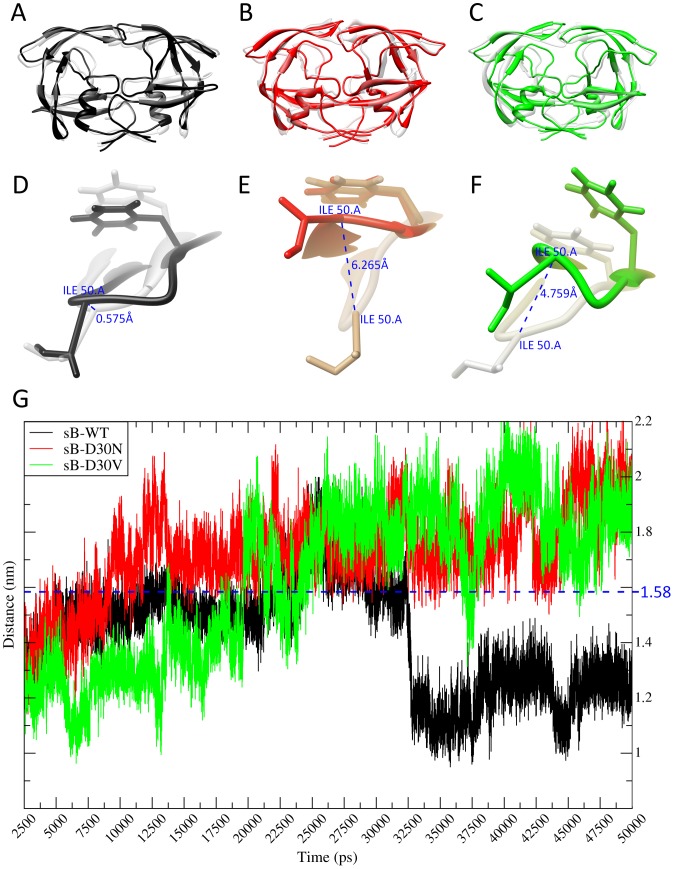
Figure 4. Structural analysis of sB-D30V.
(A) Superposition of the structures of sB-WT PR at 2,500 ps of simulation (grey) and at 50,000 ps (black). (B–C) Superposition of sB-D30N (red) and sB-D30V (green) at 50,000 ps over the respective structures at 2,500 ps (grey). (D–F) Measure of the deviation of ILE50 residue from PR Chain A considering the same structures from A, B and C, indicating the extent of Chain A flap movement. (G) Plot of the variation of the ASP25-ILE50 distance (Chain A) along the simulation. The stipulated threshold for semiopen conformation (1.58 nm) is indicated in blue.

