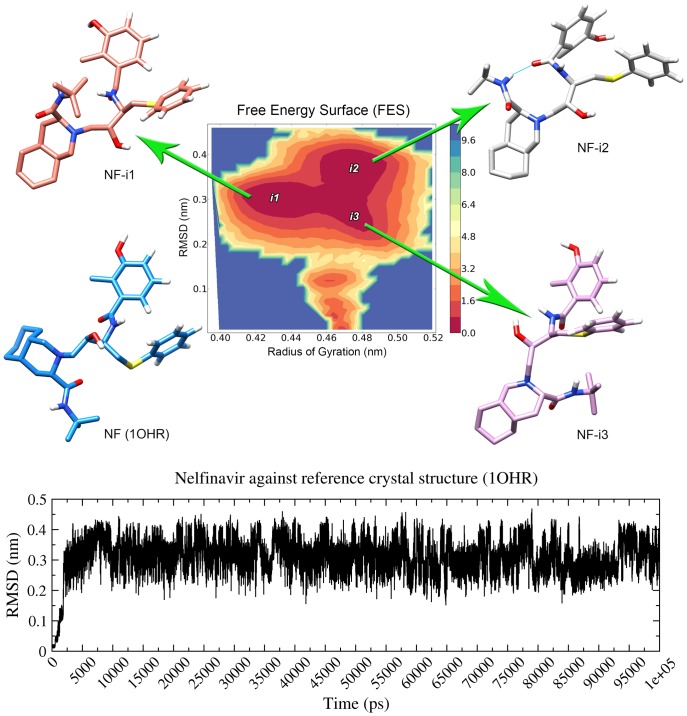
Figure 7. Conformational variability of Nelfinavir.
Structural analysis of Nelfinavir in solution along 100(FES) of this simulation (top) indicates three “islands” of low energy conformations (i1, i2 and i3), from which different structures were recovered (NF-i1, NF-i2, NF-i3). The crystal structure of Nelfinavir (1OHR) was the input conformation, and Root Mean Square Deviation (RMSD) indicates that all conformations sampled during the simulation differ from original structure by at least 0.2 nm (down).

