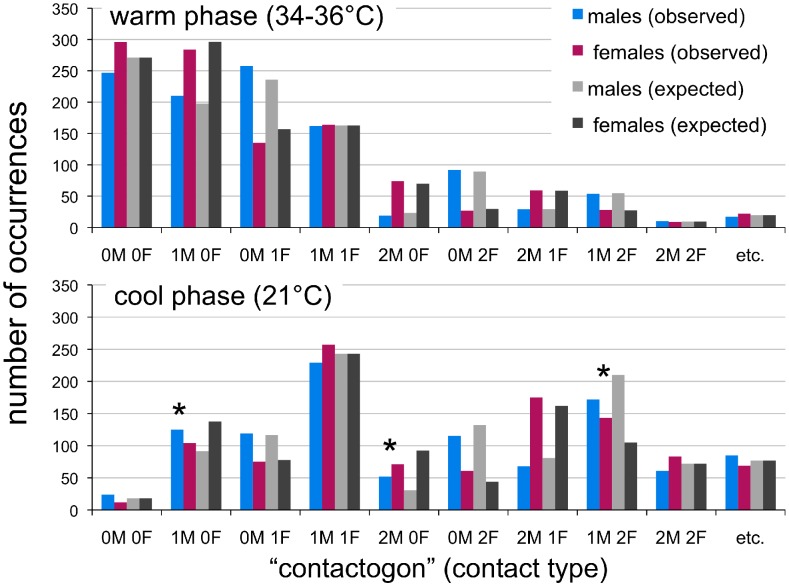
Figure 5. Contactogon distributions for warm and cool phases.
Distribution of contactogons (contact types) during the warm and cool phases of Experiment 2 (upper and lower panels, respectively). Values on the y-axis indicate total number of occurrences of each contactogon observed and expected by chance for males and females during the 50 minute trial. As can be seen, the distribution is skewed leftward, to more dispersed contactogons during the warm phase (which did not differ significantly from the chance distribution; G = 6.3, p = .705), and rightward, toward greater amounts of contact during the cool phase (which differed significantly from the distribution expected by chance; G = 39.7, p<.00001). Asterisks indicate significant deviation from chance responding in specific contactogons using Fisher’s exact tests (p<.005).

