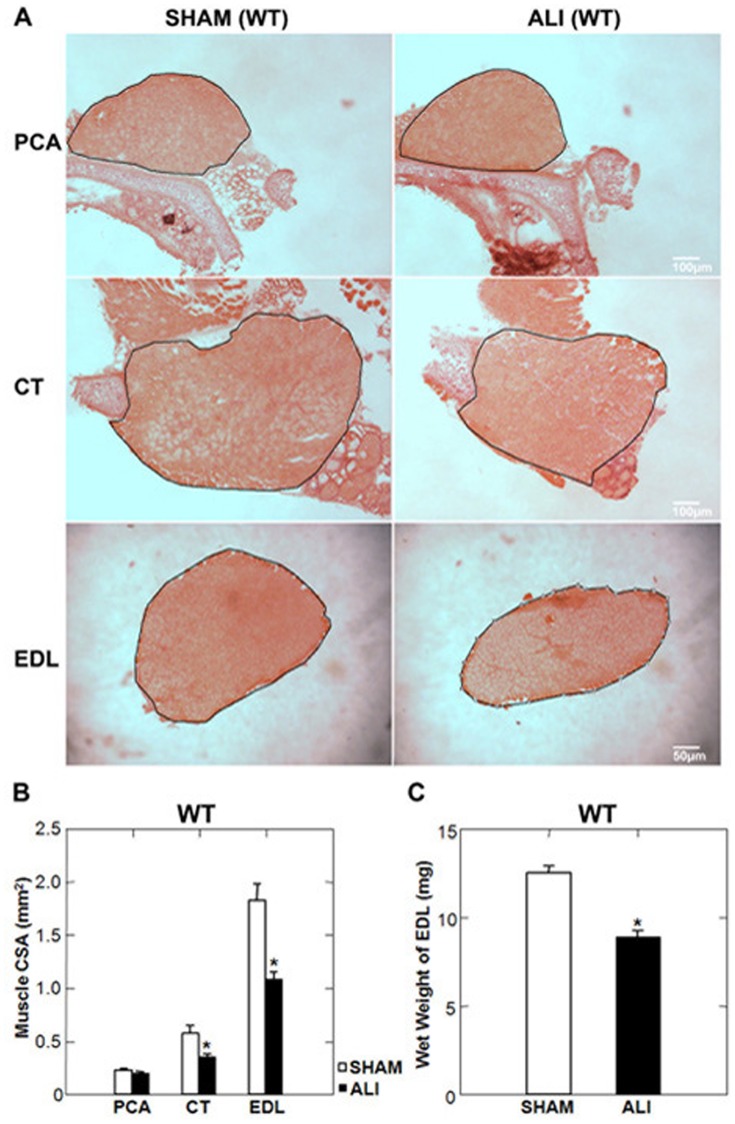
Figure 2. The PCA muscle is spared from atrophy in WT ALI mice.
A. Low power H&E stained mid-sections of the PCA, CT and EDL muscles of WT SHAM and ALI mice. The black line represents the border of the muscle boundary. B. CT and EDL muscle cross sectional areas (CSA) of ALI mice are reduced compared to SHAM, while the CSA of the PCA muscle is unchanged. C. The wet weight of the EDL is also reduced in ALI versus SHAM mice. *p<0.05; n = 5/group.

