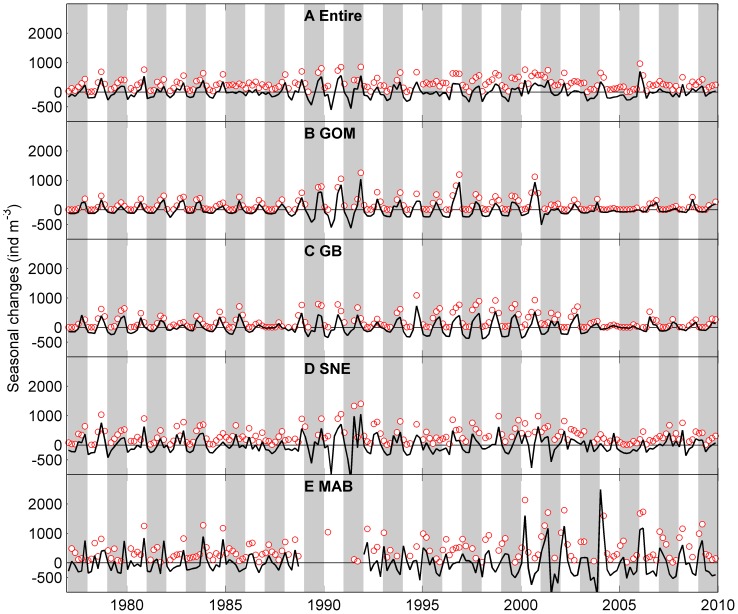
Figure 4. Bimonthly mean abundance of Centropages typicus a small temperate coastal copepod in the study area.
A: entire region, B: Gulf of Maine (GOM), C: Georges Bank (GB), D: Southern New England (SNE) and E: Mid-Atlantic Bight (MAB). Red circles represent observed bi-monthly abundance. Solid black lines represent seasonal patterns determined from the univariate time series analysis, which indicate relative changes to the long term trend rather than absolute abundances. Shaded bars represent alternate years.

