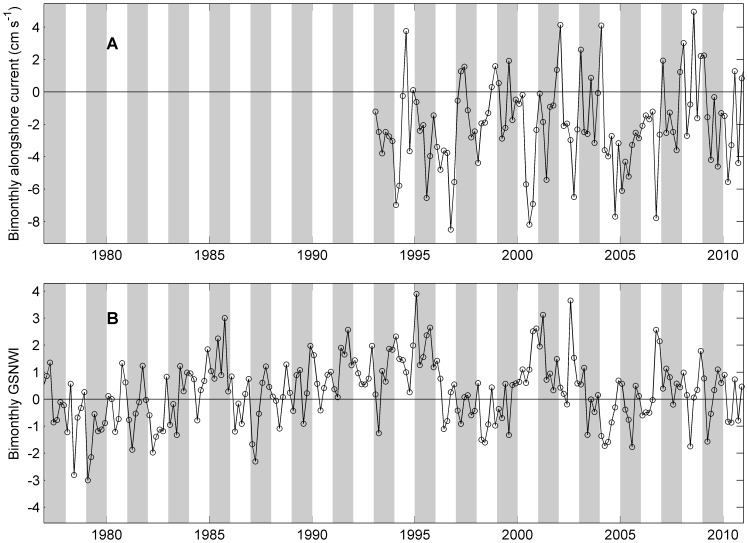
Figure 10. Bimonthly alongshore current velocities the Gulf Stream North Wall Index (GSNWI).
A: Bi-monthly alongshore current velocities with positive values indicating northward current and negative current indicating southward current. B: Bi-monthly values of GSNWI. Shaded bars represent alternate years.

