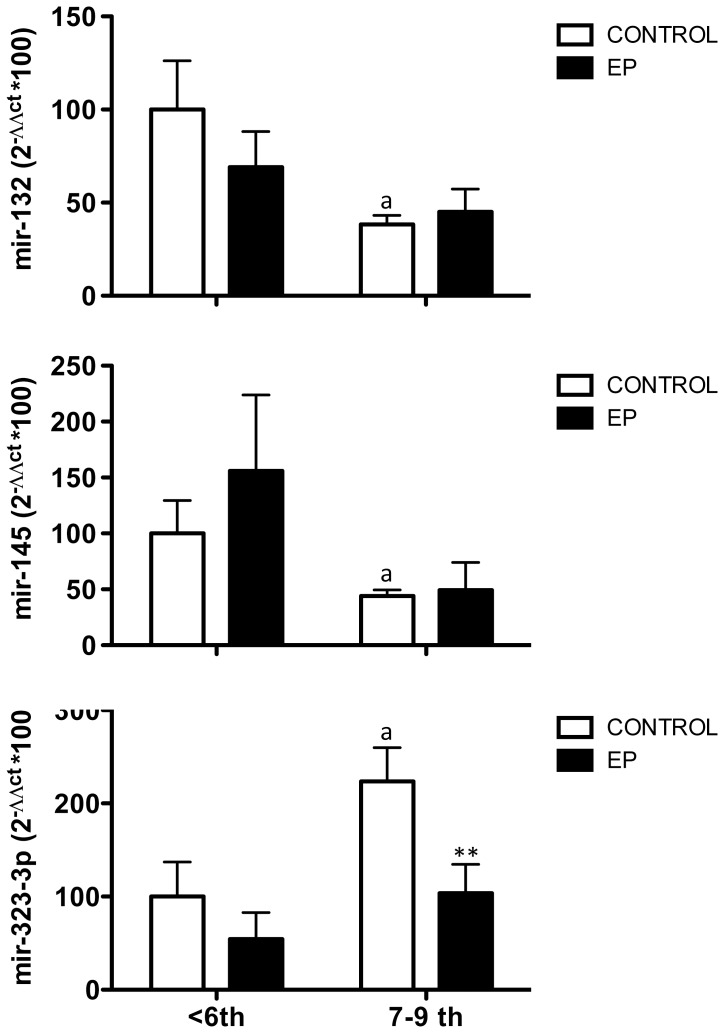
Figure 3. Expression profiles of mir-132, mir-145 and mir-323-3p in embryonic tissue from early ectopic pregnancies.
Relative levels of mir-132 mRNA (A), mir-145 and mir-323-3p (B) were assayed in embryonic samples from VTOP controls and ectopic pregnancy patients. For presentation, the data were grouped in two gestation age ranges: ≤6-week vs. 7–9 week gestational samples. Data are presented as mean ± SEM. Expression levels were quantitatively analyzed using the 2ΔΔCt method and were normalized to values from ≤6-week VTOP (control) samples. Data were analyzed by two-way ANOVA, followed by individual Newman-Keuls tests; **, P<0.01 vs. corresponding values in control samples (effect of EP); a, P<0.01 vs. corresponding values in <6-week samples (effect of gestational age).

